In this final portion of our case study on Frac Sand mining in western Wisconsin, we wanted to determine what areas within our subset of the southern portion of Trempealeau County would be best for sand mining. To do this we needed to take into consideration the suitability of the land as well as the impact that a mine would have on a given area. To do this we used a number of different raster layers including DEM (digital elevation model), land use/land cover datasets, geology and more. In order to determine the impact of a mine on a given area we implemented reclassification and euclidean distance tools to understand the impact that a mine would have on vector features like streams, residential areas etc. By creating two separate models, one for suitability and another for impact analysis we were then able to use the raster calculator in order to combine these results and ultimately determine a location index. This index would then give us a spatial representation of the best areas where sand mines should be created to minimize the impact on an area as well as be actually suitable for mining.
Methods
Suitability Model
To determine the areas which were most suitable for mining we took into consideration 5 different variables:
1. Geology
2. Land Cover Type
3. Proximity to Rail Terminals
4. Slope of the Area
5. Water Table Depth
Some of these variables were vector features and needed to first be transformed into rasters. In order to determine the most suitable portions of these layers we needed to rank them. Based on this we developed a scale of 1-3 to rank certain areas based on their suitability for mining. The ranking of 1 was given to low suitability while the ranking of 3 was given to the most suitable in most cases (Fig. 1).
 |
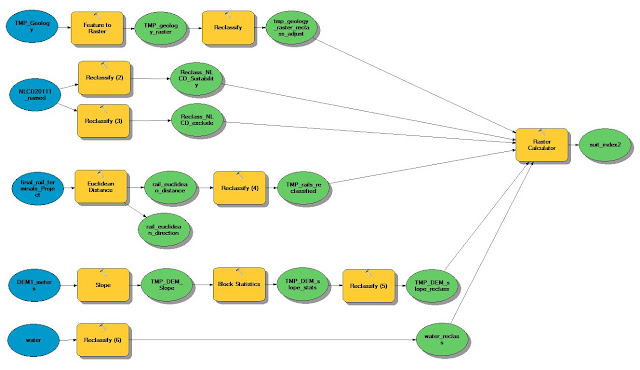
| (Fig. 2) Workflow model used to determine the suitability of an area for sand mining. |
 |
| (Fig. 3) Maps showing the output of our analysis of each of the 5 variables we took into consideration. |
To better understand the areas which would be impacted most if a mine were to be placed in a particular area we looked at the proximity to 5 variables:
1. Farmland
2. Streams
3. Residential Areas
4. Schools
5. Wildlife Areas
 |
| (Fig. 4) Workflow model used to determine the impact a sand mine would have on an area. |
 |
| (Fig. 5) This table shows how and why the rankings were developed for the impact model. |
 |
| (Fig. 7) This model shows the addition of the output of the suitability and impact models. |
 |
| Fig. 8 |
 |
| Fig. 9 |
As can be seen in Fig. 9, the areas which are the closest to orange are those which are the most optimal locations for sand mines which maximize suitability and minimize the impact on an area. Ideally only the red areas would be considered for mine locations, but this map helps developers to better understand the areas which should be most avoided in the case of sand mine development.
It is interesting to think about how easily the reclassifications can impact the overall results of the sustainability and impact models would change. Simply adjusting the values used in the rankings could drastically change the overall output.
Sources
Bureau of Transportation Statistics. (n.d.). Rail terminals feature class. Retrieved December 6, 2015, from http://www.rita.dot.gov/bts/sites/rita.dot.gov.bts/files/subject_areas/geographic_information_services/index.html
Land Records. (n.d.). Trempealeau County Land Records. Geodatabase. Retrieved December 6, 2015, from http://www.tremplocounty.com/landrecords/
United States Geological Survey, National Map Viewer. National Land Cover Database (NLCD) raster and DEM. (n.d). Retrieved December 6, 2015, from http://nationalmap.gov/viewer.html
Wisconsin Geological and Natural History Survey (GNHS). Water table contours. GIS data. (n.d). Retrieved December 6, 2015, from http://wgnhs.uwex.edu/map-data/gis-data/
Wisconsin Geological and Natural History Survey (WGNHS). B.A. Brown, 1988. Bedrock Geology of Wisconsin, West-Central Sheet, WGNHS Map 104. Digitizing by Beatriz Vidru Linhares, University of Wisconsin Eau Claire (UWEC). Retrieved from UWEC GIS resources.


No comments:
Post a Comment